
Notice
Recent Posts
Recent Comments
Tags
- magic command
- matplotlib 객제 지향 방식
- NewYork Times 읽기
- fig ax 사용
- tistory 목차
- jupyter notebook shell commands
- tistory toc
- 티스토리 자동 목차
- TOC
- 티스토리 목차
04-09 16:23
Archives
develop myself
matplotlib 사용 지침 본문
객체 지향 방식을 사용해야 하는 이유
2022 PyCon 이제현 님 발표: https://youtu.be/ZTRKojTLE8M
사용 예제
fig, axes = plt.subplots(ncols=5, figsize=(8,4))

for i, col in enumerate(['Temperature','Humidity','Light','CO2','HumidityRatio']):
    sns.boxplot(data=rooms[col],ax = axes[i])
    axes[i].set_title(col)

fig.tight_layout()
fig.subplots_adjust(top=0.8)
fig.suptitle("Room Occupancy")
fig.set_facecolor("lightgray")
plt.show()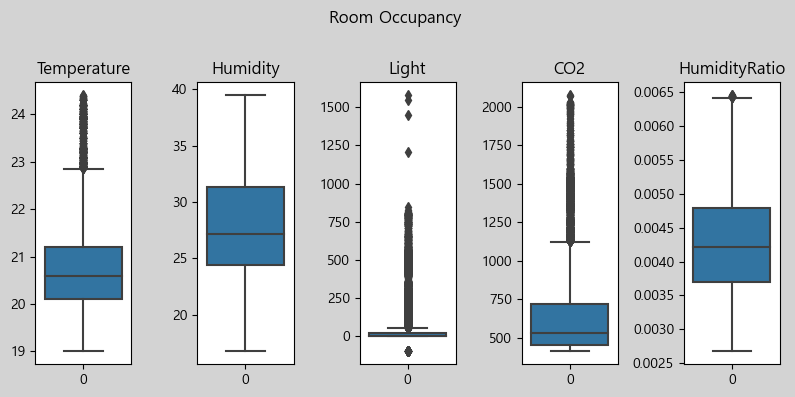
fig, axes = plt.subplots(nrows=3, ncols=3)

for i, col in enumerate(diabetes.columns):
    if diabetes[col].nunique() > 5:
        sns.histplot(x=diabetes[col], ax=axes[i//3,i%3])
    else:
        sns.countplot(x=diabetes[col], ax=axes[i//3,i%3])

fig.tight_layout()
fig.suptitle("EDA")
fig.subplots_adjust(top=0.9)
fig.set_facecolor("lightgray")

plt.show()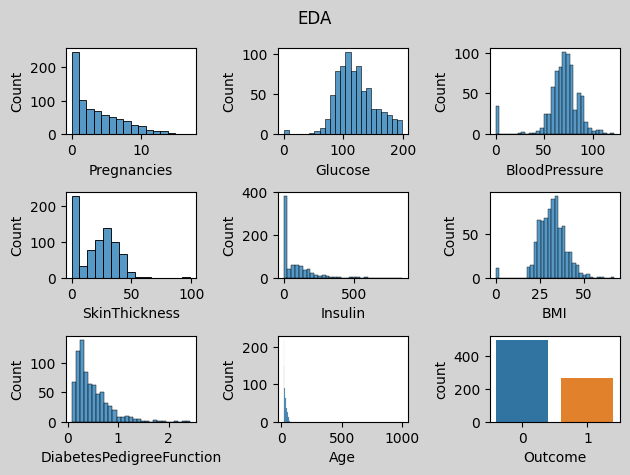
'DataScience > Python' 카테고리의 다른 글
| 데이터핸들링: 문자열(str) (0) | 2023.01.27 |
|---|---|
| 데이터 핸들링: 데이터 재구성해서 보기 (1) | 2023.01.27 |
| 데이터 핸들링: 기본 (0) | 2023.01.27 |
| matplotlib cheatsheets, handout (0) | 2023.01.26 |
| matplotlib basic tips (0) | 2023.01.26 |
'DataScience/Python' Related Articles
more

Comments